
In my last post on QE, I quoted a paper by James Hamilton and Cynthia Wu that provides some empirical evidence for the importance of the asset composition of the Fed's balance sheet and its effect on the term structure of interest rates. They have posted their data online and it makes for interesting bedtime reading.
... buying $400 billion in long-term maturities outright with newly created reserves, ... could reduce the 10-year rate by 13 basis points without raising short-term yields.
To construct these estimates, they used a theoretical model developed by Vayanos and Vila which assumes that there are investors who have a 'preferred habitat'.
The Hamilton Wu results are important. I ran some regressions of term premiums on bond supply by maturity, using their data, and I found the same orders of magnitude in the response of interest rates that they found. But there is an interesting sub-text to their analysis discussed in Section 8 of their paper. The Fed and the Treasury have been following conflicting policies. David Beckworth on his blog in 2012 makes the same point.
Quantitative Easing took place in three phases. QE1 from 11/08 to 03/10, QE2 from 11/10 to 06/11 and QE3 which is ongoing. Along with monetary expansion, the Fed attempted to refinance its portfolio by selling at the short end and buying at the long end of the yield curve. But at the same time, the Treasury was refinancing its own portfolio. The end result was that the Treasury restructuring completely swamped any effect of Fed operations at the long end of the yield curve.
 |
| Figure 1 |
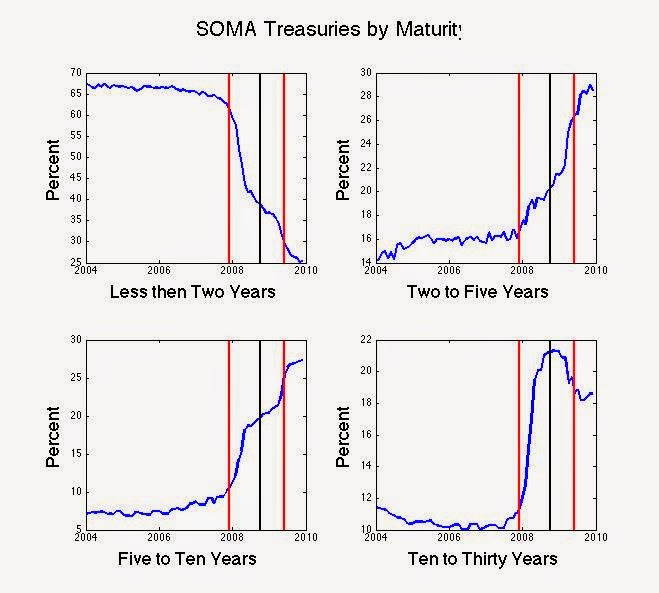
There are two takeaways from Figure 1. First, the constancy of Fed holdings by maturity in the period leading up to the recession, and second, the dramatic change in this portfolio after the collapse of Lehmann Brothers. The big increase in Fed holdings at the long end is the result of 'operation twist'.
How big a player is the Fed in the Treasury markets? Leading up to the Great Recession, the Fed held 12% of all Treasuries with a maturity of two years or less, 3% of two to five year maturities, 1.5% of five to ten year maturities and 2% of maturities from ten to thirty years. Once the recession hit, Fed holdings of maturities shorter than two years plummeted, and longer maturities increased.
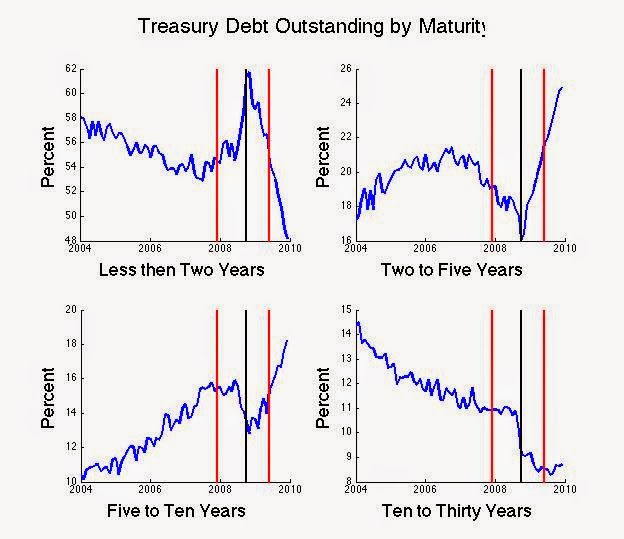
But Figure 1 gives a misleading picture of Fed actions in response to the crisis since it divides SOMA holdings, chosen by the Fed, by total outstanding Treasury debt. There were two important changes going on during the recession. First, the Treasury dramatically changed the way it finances its deficit, substituting two to ten year bonds for shorter maturities. And second, the proportion of bonds held by the Fed fell dramatically.
 |
| Figure 2 |
 |
| Figure 3 |
Figure 1 divides SOMA holdings by total Treasury debt outstanding. In contrast, in Figure 3 I divide Fed SOMA holdings by the Fed's holding of all maturities. This figure DOES reflect decisions made by the open market committee of the Fed. The Fed's holdings of short term bonds fell from 65% of its portfolio in 2007 to 25% in 2010. In contrast, holdings of two to five year bonds increased from 17% to 30%, five to ten year bonds increased from 6% to 26% and ten to thirty year bonds went from 12% to 19%. These are all percentages of the Fed's total Treasury holdings.
 |
| Figure 4 |
Could we have a little coordination here guys?
__________________
Footnote: The Hamilton Wu data have since been updated through January of 2011 but I haven't had time yet to update my figures using their revisions.