
Simon Wren-Lewis has a great post today on what makes a Keynesian. Here is my answer together with a quiz for wannabe Keynesians.
Figure 1 is a picture that goes by the name of the Keynesian cross. On the horizontal axis is income; the value of all wages, rents and profits earned from producing goods and services in a given year. On the vertical axis is planned expenditure; the value of all spending on goods and services produced in the economy in a given year. Since this is a closed economy, all expenditure is allocated to one of three categories; expenditure on consumption goods, expenditure on investment goods and government purchases. Since every dollar spent must generate income for someone; in a Keynesian equilibrium, income must equal planned expenditure.
The upward sloping green line, at 45 degrees to the origin, is the Keynesian aggregate supply curve. This green line is the Keynesian theory of aggregate supply. It says that whatever is demanded will be supplied.
The upward sloping red line is the Keynesian theory of aggregate demand. In its simplest form, G and I, represent exogenous spending by government and by investors. The idea that investment is exogenous, was Keynes' way of closing the system. He thought that investment is driven by the animal spirits of investors.
The Keynesian model says, that in equilibrium, the economy will come to rest at a point where the green line and the red line cross. There is no necessary reason why that point should be associated with full employment, and most of the time, it won't be: Hence, the title of Keynes' book, the General Theory of Employment Interest and Money.
The jewel in the crown of Keynesian theory is the consumption function, represented by the equation,
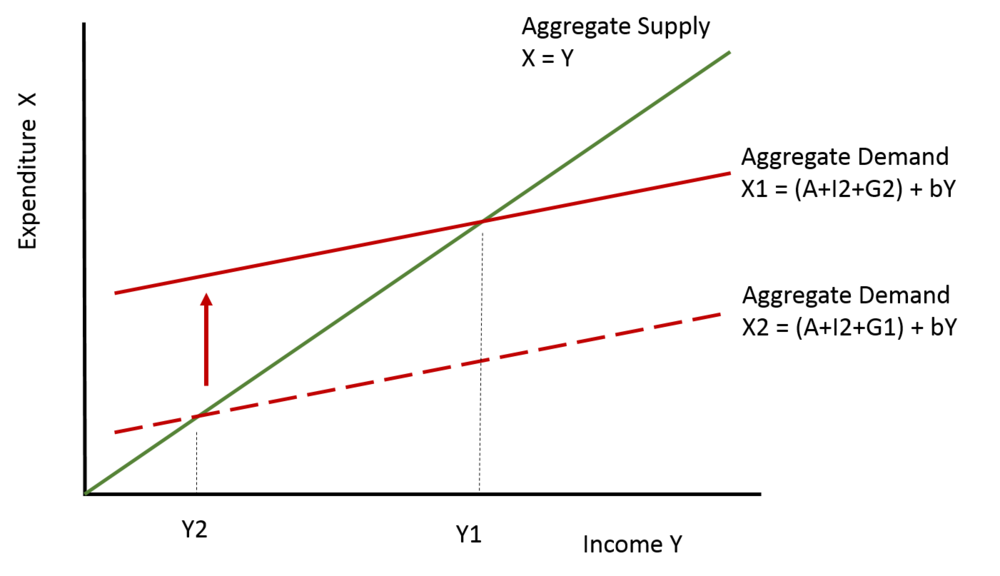
Figure 2 is the Keynesian explanation for the Great Depression. The top red line, labelled X1, represents expenditure in 1929 before the stock market crash. Government purchases were equal to G and investment was equal to I1.
The lower red line, labelled X2, represents expenditure in 1932, after the stock market crash. Government purchases were still equal to G, but investment fell from I1 to I2. This shifted down the Keynesian aggregate demand curve and led to a drop in income that was bigger than the original drop in I. Expenditure, equal to income, came to rest at point Y2. The fall in Y was bigger than the fall in I because, as investment fell, so consumption also fell. And every one dollar of reduced consumption led to an additional drop in income of b dollars. That at least is the theory.
First, let me delve into a little highbrow theory.
 |
| Figure 1: The Keynesian Cross |
Figure 1 is a picture that goes by the name of the Keynesian cross. On the horizontal axis is income; the value of all wages, rents and profits earned from producing goods and services in a given year. On the vertical axis is planned expenditure; the value of all spending on goods and services produced in the economy in a given year. Since this is a closed economy, all expenditure is allocated to one of three categories; expenditure on consumption goods, expenditure on investment goods and government purchases. Since every dollar spent must generate income for someone; in a Keynesian equilibrium, income must equal planned expenditure.
The upward sloping green line, at 45 degrees to the origin, is the Keynesian aggregate supply curve. This green line is the Keynesian theory of aggregate supply. It says that whatever is demanded will be supplied.
The upward sloping red line is the Keynesian theory of aggregate demand. In its simplest form, G and I, represent exogenous spending by government and by investors. The idea that investment is exogenous, was Keynes' way of closing the system. He thought that investment is driven by the animal spirits of investors.
The Keynesian model says, that in equilibrium, the economy will come to rest at a point where the green line and the red line cross. There is no necessary reason why that point should be associated with full employment, and most of the time, it won't be: Hence, the title of Keynes' book, the General Theory of Employment Interest and Money.
The jewel in the crown of Keynesian theory is the consumption function, represented by the equation,
C = A + bY,
where A is autonomous consumption spending (this is a constant) and b is the marginal propensity to consume (this is a number between zero and one).
 |
| Figure 2: The Great Depression |
The lower red line, labelled X2, represents expenditure in 1932, after the stock market crash. Government purchases were still equal to G, but investment fell from I1 to I2. This shifted down the Keynesian aggregate demand curve and led to a drop in income that was bigger than the original drop in I. Expenditure, equal to income, came to rest at point Y2. The fall in Y was bigger than the fall in I because, as investment fell, so consumption also fell. And every one dollar of reduced consumption led to an additional drop in income of b dollars. That at least is the theory.
Keynes' remedy? Government must spend to replace the lost investment spending.
 |
| Figure 3: The Keynesian Remedy |
Figure 3 shows how that is supposed to work. The lower dashed red line is aggregate demand in 1932 in the depth of the Depression. Government purchases did not change much during the 1930s, but as the world entered WWII, government purchases in the U.S. increased from 15% of the economy to 50% in the space of three years. As G increased from G1 to G2, the dashed red line on Figure3 shifted up and expenditure went from X2 back up to X1. Notice that G2 + I2 on Figure 3 equals I1 + G on Figure 2.
The increase in the size of government in war time was huge and was enough to restore full employment at Y1; but now the spending that had been carried out in 1929 by the private sector was carried out in 1943 by the government. We cured the unemployment problem by putting all of those unemployed people in the army.
It is also worth pointing out that private consumption expenditure fell during WWII. Keynesian theory predicts that it should have increased. That fact is a bit uncomfortable for textbook Keynesians who appeal to the special circumstances of a wartime economy. Here's Tyler Cowen's take on that debate.
OK: enough theory. Here is My Quiz for Wannabe Keynesians.
1: Does demand determine employment? Is the 45 degree line an aggregate supply curve? And if you answered yes to this question: Is the 45 degree line a theory of aggregate supply in the short run, or in the long run?
2: Does you answer to (1) depend on the assumption that prices are sticky?
3: Is the Keynesian consumption function a good way to think about aggregate demand? Does consumption depend on income, and if so, what is the value of the marginal propensity to consume?
If you answered YES to all three questions, you are a bonafide card carrying Keynesian of the New York Times variety.
Here are: My answers to My Quiz for Wannabe Keynesians
1). YES. The 45 degree line is an aggregate supply curve. Further, it is a LONG RUN aggregate supply curve. Forget about a vertical Phillips curve. It simply is not there in the data.
2). NO. The fact that anything demanded will be supplied has absolutely nothing to do with sticky prices or wages. I repeat; the 45 degree line is a LONG RUN aggregate supply curve. Prices and wages are determined by monetary factors and by beliefs and there is little or no evidence that they adjust to clear markets as classical theorists would tell us.
3). NO. The Keynesian theory of consumption is not a good theory of aggregate demand. The evidence for a large multiplier is weak or non existent. I am perfectly willing to be proved wrong on that point; but I have kept up with all of the available evidence (nicely summarized here by James Hanley) and I do not find it convincing.
Valery Ramey's work suggests that the multiplier, if anything, is slightly less than 1 and she finds that
Am I a Keynesian? I believe I am; but you can judge for yourself. My work explains (1). I am skeptical about (2) because the evidence suggests no stable connection between unemployment and inflation. In my view ANY combination of unemployment and inflation can hold in a steady state equilibrium. The assertion that we must cure unemployment with traditional fiscal policy is not supported by the facts and arises from a doctrinaire approach to the evidence.
The challenge for macroeconomic theory is to understand how fluctuations in asset markets are transmitted to aggregate demand and the fact that I am skeptical about the effectiveness of traditional fiscal policy does not mean that I think that the market should be left to correct itself. There are alternative policies we can try. But that is a story for another day.
...in most cases private spending falls significantly in response to an increase in government spending.Perhaps things are different at the lower bound? Nope! Ramey and Zubairy
...find no evidence that multipliers are different across states, whether defined by the amount of slack in the economy or whether interest rates are near the zero lower bound.I am not a right wing market touting Chicago card carrying loyalist. I want to find evidence to support effective policies to combat recessions. But I am tired of listening to diatribes arguing that there is incontrovertible evidence that fiscal policy is effective at the lower bound. There isn't.
Am I a Keynesian? I believe I am; but you can judge for yourself. My work explains (1). I am skeptical about (2) because the evidence suggests no stable connection between unemployment and inflation. In my view ANY combination of unemployment and inflation can hold in a steady state equilibrium. The assertion that we must cure unemployment with traditional fiscal policy is not supported by the facts and arises from a doctrinaire approach to the evidence.
The challenge for macroeconomic theory is to understand how fluctuations in asset markets are transmitted to aggregate demand and the fact that I am skeptical about the effectiveness of traditional fiscal policy does not mean that I think that the market should be left to correct itself. There are alternative policies we can try. But that is a story for another day.