Not Keen on more Chaos in the Future of Macroeconomics

Steve Keen argues that we should use chaos theory as a future foundation for macroeconomics. We tried that thirty-five years ago and rejected it. Here’s why.  

In response to Olivier Blanchard’s recent attempt to move towards a consensus in macroeconomics, Steve Keen has launched a blistering attack on the DSGE approach. His thesis is that the economy is best modeled as a complex adaptive system. I am, or at least was, very receptive to that idea. But in contrast to Steve, I believe that DSGE models are here to stay, just not New Keynesian DSGE models.

Complexity theory is not a new idea in economics. In June of 1985, Jean-Michel Grandmont and Pierre Malgrange organized a conference in Paris. The conference was dedicated to the idea that the economy is inherently non-linear and that the applications that Steve Keen cites as successful examples of non-linear theory in the physical sciences could be extended to economics.  I was privileged to attend that conference and to present a paper on non-linear business cycles. Many of the conference papers were published in the Journal of Economic Theory.

Among the highlights at the 1985 conference were an important paper by Michele Boldrin and Luigi Montruchio which demonstrated that the representative agent growth model can display chaotic dynamics. Michael Woodford presented a paper entitled “Stationary Sunspot Equilibria in a Finance Constrained Economy”. Roger Guesnerie, Jean Michel Grandmont, Donald Saari, Steven R. Williams, Roes-Anne Danna, Guy Laroque, Raymond Deneckere, Steve Pelikam and Pietro Recclin all presented papers that appeared in the conference volume. Frank Hahn attended and was his usual perceptive and boisterous self. Karl Shell presented a paper that Grandmont later rejected for JET (a somewhat ballsy decision since Karl was editor of JET at the time).  This was also the first time I met Jess Benhabib. We went on to write our classic paper on indeterminacy.

The attendees were a relative who’s who of European and American mathematical economists and the agenda was clear. Can we translate the success of chaos theory and non-linear dynamics from the physical sciences into economics? The answer was very clear. Non!

For me, and I believe for many others, the highlight of the conference was a paper by the American economist William (Buzz) Brock with the title “Distinguishing Random and Deterministic Systems”.  This is a wonderful paper and I recommend you read it. In his conference presentation, Buzz described an experiment that changed the world of fluid dynamics. At one time, physicists described the motion of turbulence in fluids with a high dimensional linear system hit by random shocks. It turns out, the world is not like that. And physicists can prove it.

Buzz described an experiment, conducted by physicists, in which they take two cylinders and put a colored fluid between them. As they rotate the inner cylinder, the motion of the fluid moves from calm motion through cycles to chaos. To measure this transition, they shine a strobe light through the fluid and record a sequence of dots. As the speed of rotation increases, there comes a point where the sequence of dots is well described by a three dimensional differential equation system with a chaotic attracting set. The path of any given sequence is completely deterministic but any given path is sensitive to initial conditions. Paths that initially start close together begin to diverge. This is the ‘butterfly wings’ phenomenon. A butterfly flapping its wings in Brazil can cause a hurricane in the Caribbean.

The obvious question that Buzz asked was: are economic systems like this? The answer is: we have no way of knowing given current data limitations. Physicists can generate potentially infinite amounts of data by experiment. Macroeconomists have a few hundred data points at most. In finance we have daily data and potentially very large data sets, but the evidence there is disappointing. It’s been a while since I looked at that literature, but as I recall, there is no evidence of low dimensional chaos in financial data.

Where does that leave non-linear theory and chaos theory in economics? Is the economic world chaotic? Perhaps. But there is currently not enough data to tell a low dimensional chaotic system apart from a linear model hit by random shocks. Until we have better data, Occam’s razor argues for the linear stochastic model.

If someone can write down a three equation model that describes economic data as well as the Lorentz equations describe physical systems: I'm all on board. But in the absence of experimental data, lots and lots of experimental data, how would we know if the theory was correct?

The Liquidity Trap and How to Escape It: Time for a New Approach

We are stuck in a low inflation liquidity trap, caused by the fact that money and short term securities are currently perfect substitutes. The way out of the liquidity trap is to raise the interest rate; an argument that has been called neo-Fisherian in recent blog posts by Stephen Williamson and Noah Smith. Raising the interest rate however, and doing nothing else, will generate a recession; possibly a large and persistent recession. To prevent that from happening, the Treasury must engage in a simultaneous fiscal expansion. That fiscal expansion could be achieved through a money financed transfer to households; it could also be more efficiently achieved through a government guarantee to support asset prices.

A fiscal expansion can occur through infrastructure expenditure, through a tax cut, or a cash transfer to households. And any given expansion can be paid for by printing money or by issuing short-term or long-term government bonds. According to conventional wisdom, it doesn’t matter whether the government borrows by issuing short-term bonds or long-term bonds. Conventional wisdom is wrong as I have shown in a series of books and papers, for example, see here.

Some have argued that the government should build roads and bridges and that this new infrastructure expenditure should be paid for by issuing long-term debt. That argument makes sense. But it is logically distinct from the argument for a fiscal stimulus. Build roads and bridges to support private sector growth; the Northern Powerhouse of George Osborne. And, by all means, pay for these investments by issuing long-term bonds. New projects of this kind should be weighed carefully and a case must be made that they have positive net present value.

Do not build roads and bridges as a temporary stimulus. A better way to prevent the recession that might otherwise occur when the Bank raises the Bank Rate would be an explicit commitment by the Financial Policy Committee of the Bank of England, to support the value of the stock market. This could be achieved by offering to buy or sell shares in an Exchange Traded Fund at a value linked to the performance of the unemployment rate. [1]

The private sector does not typically find the right price for stocks and shares. Animal spirits represent a separate independent fundamental of the economy; they are like technology or preferences. And the state of animal spirits is reflected in the price that households are prepared to pay for stocks and shares.

The role of fiscal policy is to counteract the influence of animal spirits by helping markets to coordinate on a ‘good equilibrium’. In the absence of the direction of the Treasury or the Central Bank, asset markets are often trapped like the proverbial prisoner in the ‘prisoners’ dilemma’ who confesses to avoid the fate that would await him if his partner in crime were to confess first.

My argument is not made lightly. My recent books and articles provide a coherent alternative to the conventional New Keynesian paradigm and I provide empirical evidence that demonstrates a stable link between asset prices and the unemployment rate.

Conventional wisdom argues that the path to higher inflation lies through lowering interest rates. That path is supposed to trigger a demand expansion, higher employment and higher wages and prices. But the link from unemployment to wage inflation, the so-called ‘Phillips Curve’ has not existed since Phillips published his eponymous article in 1958. It was an artifact of the gold exchange standard when monetary policy operated very differently from the way it operates today.

The evidence from twenty years of stagnation in Japan does not inspire confidence in a policy of lowering interest rates further. It’s time for new approach.

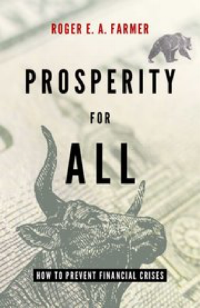
You can read more about these ideas in my new book Prosperity for All.

_____________________

[1] A second best fiscal policy, that has a greater political chance of happening in the current climate, is a cash transfer to households paid for by printing money. I would support this policy as a way of preventing a recession; but it is not ideal because it does not correct the problem that assets may be incorrectly priced.  

My Slides for the SNB Research Conference

Karl Brunner: 1916 -- 1989 

Karl Brunner: 1916 -- 1989 

I had the privilege of attending a conference in Zurich yesterday in honor of what would have been Karl Brunner's 100th birthday. This is the first of a series the Swiss National Bank (SNB) has established, kicked off with a keynote address from Ken Rogoff. 

The celebration of Karl's contribution to economics was followed up by the 10th in a series of terrific SNB research conferences. We're currently at the end of the first day and I've learned a lot from interacting with academics and central bankers in a beautiful environment on the edge of Lake Zurich. 

I presented my paper with Pawel Zabczyk, "The Theory of Unconventional Monetary Policy". Here is a link to my paper, and here is a link to my slides (easier to follow and more fun than the paper itself).

Unemployment and Hours are Very Different Creatures

In a post in 2014 that was fairly scathing about the RBC model, I made the claim that long-run shifts in the unemployment rate are caused by 'animal spirits'. My confidence in making that claim is supported by empirical work which establishes that the unemployment rate and the real value of stock-market wealth are both non-stationary but co-integrated.

In words, neither the unemployment rate, nor the stock market (measured relative to money wages) shows any tendency to return to a fixed number. But a weighted sum of unemployment and the stock market (called a co-integrating vector) DOES return to a fixed number. In a previous post I put it this way: the unemployment rate and the stock market are like two drunks walking down the street tied together by a rope. They can never get too far apart from each other.

Brad Delong thinks that it would be better to assert that long-run shifts in the employment-to-population ratio are caused by 'animal spirits'.  I don't think he is right. 

If by 'employment' we means hours in paid employment, the employment-to-population ratio changes for three reasons. More or less people enter the labor force. More or less people in the labor force find jobs. And those people with jobs vary the number of hours they work. 

Chart 1: Labor Force Participation and Unemployment.   (c) Source: Prosperity for All, 2016, Oxford University Press page 54.

Chart 1: Labor Force Participation and Unemployment.   (c) Source: Prosperity for All, 2016, Oxford University Press page 54.

Chart 1 shows the unemployment rate in blue plotted on the left axis and the labor force participation rate (LFPR) in red plotted on the right axis. My take on this graph is that most of the movements in the participation rate are secular. They do not vary much during recessions (plotted as the grey shaded areas), relative to their movements over long periods of time. I suspect that most of the low-frequency movements in participation can be explained by demographic changes and sociological factors that caused women to enter the labor force en masse in the 1960s.  Research from the St. Louis Fed supports this claim.

Chart 2: Hours and Unemployment.  (c) Source: Prosperity for All, 2016, Oxford University Press page 53.

Chart 2: Hours and Unemployment.  (c) Source: Prosperity for All, 2016, Oxford University Press page 53.

The other possible reason for changes in the employment-to-population ratio is that it is caused by changes in hours. Chart 2, which plots average hours per week in the private sector in red, measured on the right axis, and unemployment in blue on the left axis, suggests that hours also do not have much to do with recessions. The main feature of average hours per week is that they have followed a steady secular decline from roughly 39 hours per week in 1964 to 34 hours per week in 2016. As American workers became wealthier, they chose to work less. 

In two recent empirical papers, here and here, I studied the connection between the real value of the stock market and the unemployment rate. Charts 1 and 2 explain why I chose the unemployment rate, rather than the employment-to-population ratio, as my object of study.  

You can read much more about this research in my book Prosperity for All which is available NOW on kindle and can be purchased as a real old-fashioned print book from OUP here (coming to amazon very soon).